-
New Features and Enhancements
What's New in MATLAB?
MATLAB, the language of technical computing, has been designed to increase the scope and productivity of science and engineering, to accelerate the pace of discovery and development, to facilitate learning, and to amplify the creativity of research. MATLAB 5, the newest version of the MATLAB environment, vastly enhances programmer productivity, providing many ease-of-use/ease-of-learning features that enable the rapid development of larger and more complex applications. Befitting its name, MATLAB 5 features five major areas of programming innovation:
Enhanced Programming and Application Development Tools
MATLAB 5 provides new M-file programming enhancements and application development tools that make it easier than ever to develop and maintain applications in MATLAB. Highlights include:
New Data Types, Structures, and Language
Features
MATLAB 5 introduces new data types and language improvements. These new features make it easy to build much larger and more complex MATLAB applications.
Faster, Better Graphics and Visualization
Graphics take another quantum leap with powerful new visualization techniques and significantly faster image display using the Z-buffer algorithm. Presentation graphics are also improved to give you more options and control over how you present your data.
More Mathematics and Data Analysis Firepower
Enhancements to Application Toolbox Suite and to SIMULINK
New Data Constructs
MATLAB 5 supports these new data constructs:
In addition, MATLAB 5 features an improved storage method for string data.
Multidimensional Arrays
Arrays (other than sparse matrices) are no longer restricted to two dimensions. You can create and access arrays with two or more dimensions by
MATLAB functions like zeros, ones, and rand have been extended to accept more than two dimensions as arguments. To create a 3-by-4-by-5 array of ones, for example, use
A = ones(3,4,5)
The new cat function enables you to concatenate arrays along a specified dimension. For example, create two rectangular arrays A and B:
A = [1 2 3; 4 5 6];
B = [6 2 0; 9 1 3];
To concatenate these along the third dimension:
C = cat(3,A,B)

C(:,:,1) =

     1     2     3
     4     5     6


C(:,:,2) =

     6     2     0
     9     1     3
You can also create an array with two or more dimensions in which every element has the same value using the repmat function. repmat accepts the value with which to fill the array, followed by a vector of dimensions for the array. For example, to create a 2-by-2-by-3-by-3 array B where every element has the value pi:
B = repmat(pi,[2 2 3 3]);
You can also use repmat to replicate or "tile" arrays in a specified configuration.
New Multidimensional Array Functions
Function
Description
cat
| Concatenate arrays.
|
flipdim
| Flip array along specified dimension.
|
ind2sub
| Subscripts from linear index.
|
ipermute
| Inverse permute the dimensions of a multidimensional array.
|
ndgrid
| Generate arrays for multidimensional functions
and interpolation.
|
ndims
| Number of array dimensions.
|
permute
| Rearrange the dimensions of a multidimensional
array.
|
reshape
| Change size.
|
shiftdim
| Shift dimensions.
|
squeeze
| Remove singleton array dimensions.
|
sub2ind
| Single index from subscripts.
|
| |
|---|
Cell Arrays
Cell arrays have elements that are containers for any type of MATLAB data, including other cells. You can build cell arrays using assignment statements (for instance, A(2,2) = {'string'}), or by using the new cell function.
New Cell Array Functions
Function
Description
cell
| Create cell array.
|
cell2struct
| Cell array to structure array conversion.
|
celldisp
| Display top-level structure of cell array.
|
cellplot
| Graphically display the structure of a cell array.
|
num2cell
| Convert a matrix into a cell array.
|
| |
|---|
Structures
Structures are constructs that have named fields containing any kind of data. For example, one field might contain a text string representing a name (patient.name = 'Jane Doe'), another might contain a scalar representing a billing amount (patient.billing = 127.00), and a third might hold a matrix of medical test results. You can organize these structures into arrays of data. Create structure arrays by using individual assignment statements or the new struct function.
New Structure Functions
Function
Description
fields
| Field names of structure array.
|
getfield
| Get field of structure array.
|
rmfield
| Remove structure fields.
|
setfield
| Set field of structure array.
|
struct
| Create structure array.
|
struct2cell
| Structure to cell array conversion.
|
| |
|---|
Character Arrays
Strings now take up less memory than they did in previous releases.
MATLAB 4 required 64 bits per character for string data. MATLAB 5 requires only 16 bits per character.
New Character String Functions
Function
Description
base2dec
| Base B to decimal number conversion.
|
bin2dec
| Binary to decimal number conversion.
|
char
| Convert numeric values to string.
|
dec2base
| Decimal number to base conversion.
|
dec2bin
| Decimal to binary number conversion.
|
mat2str
| Convert a matrix into a string.
|
strcat
| String concatenation.
|
strmatch
| Find possible matches for a string.
|
strncmp
| Compare the first n characters of two strings.
|
strvcat
| Vertical concatenation of strings.
|
| |
|---|
The MATLAB programming language does not require the use of data types. For many applications, however, it is helpful to associate specific attributes with certain categories of data. To facilitate this, MATLAB allows you to work with objects. Objects are typed structures. A single class name identifies both the type of the structure and the name of the function that creates objects belonging to that class.
Objects differ from ordinary structures in two important ways:
The structure fields of objects are not visible from the command line. Instead, you can access structure fields only from within a method, an M-file associated with the object class. Methods reside in class directories. Class directories have the same name as the class, but with a prepended @ symbol. For example, a class directory named @inline might contain methods for a class called inline .
You can create methods that override existing M-files. If an object calls a function, MATLAB first checks to see if there is a method of that name before calling a supplied M-file of that name. You can also provide methods that are called for MATLAB operators. For objects a and b, for instance, the expression a + b calls the method plus(a,b) if it exists.Programming Capabilities
MATLAB 5 includes flow-control improvements and new M-file programming tools.
Flow Control Improvements
MATLAB 5 features:
The switch statement is a convenient way to execute code conditionally when you have many possible cases to choose from. It is no longer necessary to use a series of elseif statements:
switch input_num
    case -1
        disp('negative one');
    case 0
        disp('zero');
    case 1
        disp('positive one');
    otherwise
         disp('other value');
end
Only the first matching case is executed.
switch can handle multiple conditions in a single case case expression in a cell array. For example, assume method exists as a string variable:
switch lower(method)
    case {'linear','bilinear'}, disp('Method is linear')
    case 'cubic', disp('Method is cubic')
    case 'nearest', disp('Method is nearest')
    otherwise, disp('Unknown method.')
end
New Flow Control Commands
Command
Description
case
| Case switch.
|
dbmex
| Enable MEX-file debugging.
|
errortrap
| Skip errors during testing.
|
otherwise
| Default part of switch statement.
|
switch
| Conditionally execute code, switching among several cases.
|
| |
|---|
MATLAB now evaluates expressions involving logical operators more efficiently than before. For example, consider the expression if a|b. If a is true, then MATLAB will not evaluate b. Similarly, MATLAB won't execute statements following the expression if a&b in the event a is found to be false.
New Logical Operators
Operator
Description
iscell
| True for a cell array.
|
isequal
| True if arrays are equal.
|
isfinite
| True for finite elements.
|
islogical
| True for logical arrays.
|
isnumeric
| True if input is a numeric array.
|
isprime
| True for prime numbers
|
isspace
| True for space, newline, carriage return, tab, vertical tab, or formfeed.
|
isstruct
| True for a structure.
|
logical
| Convert numeric values to logical vectors.
|
| |
|---|
M-File Programming Tools
MATLAB 5 adds three features to enhance MATLAB's M-file programming capabilities.
Variable Number of Input and Output Arguments
The varargin and varargout commands simplify the task of passing data into and out of M-file functions. For instance, the statement function varargout = myfun(A,B) allows M-file myfun to return an arbitrary number of output arguments, while the statement function [C,D] = myfun(varargin) allows it to accept an arbitrary number of input arguments.
Multiple Functions Within an M-File
It is now possible to have subfunctions within the body of an M-file. These are functions that the primary function in the file can access but that are otherwise invisible.
M-File Profiler
This utility lets you debug and optimize M-files by tracking cumulative execution time for each line of code. Whenever the specified M-file executes, the profiler counts how many time intervals each line uses.
Pseudocode M-Files
The pcode command saves a pseudocode version of a function or script to disk for later sessions. This pseudocode version is ready-to-use code that MATLAB can access whenever you invoke the function. In some cases, this reduces the time it takes to execute a function.
New Programming Tools
Function
Description
addpath
| Append directory to MATLAB's search path.
|
applescript
| Load a compiled AppleScript from a file and execute
it.
|
assignin
| Assign variable in workspace.
|
edit
| Edit an M-file.
|
editpath
| Modify current search path.
|
evalin
| Evaluate variable in workspace.
|
fullfile
| Build full filename from parts.
|
inmem
| Functions in memory.
|
inputname
| Input argument name.
|
mfilename
| Name of the currently running M-file.
|
mexext
| Return the MEX filename extension.
|
pcode
| Create pseudo-code file (P-file).
|
profile
| Measure and display M-file execution profiles.
|
rmpath
| Remove directories from MATLAB's search path.
|
varargin,
varargout
| Pass or return variable numbers of arguments.
|
warning
| Display warning message.
|
web
| Point web browser at file or web site.
|
| |
|---|
New and Enhanced Language Functions
MATLAB 5 provides a large number of new language functions as well as enhancements to existing functions.
New Elementary and Specialized Math Functions
Function
Description
airy
| Airy functions.
|
besselh
| Bessel functions of the third kind (Hankel).
|
condeig
| Condition number with respect to eigenvalues.
|
condest
| 1-norm matrix condition estimate.
|
dblquad
| Numerical double integration
|
mod
| Modulus (signed remainder after division).
|
normest
| 2-norm estimate.
|
| |
|---|
New Time and Date Functions
Function
Description
calendar
| Calendar.
|
datenum
| Serial date number.
|
datestr
| Create date string.
|
datetick
| Date formatted tick labels.
|
datevec
| Date components.
|
eomday
| End of month.
|
now
| Current date and time.
|
weekday
| Day of the week.
|
| |
|---|
New Ordinary Differential Equation Functions
Function
Description
ode45, ode23, ode113,
ode23s, ode15s
| Solve differential equations, low and high
order methods.
|
odefile
| Define a differential equation problem for
ODE solvers.
|
odeget
| Extract options from an argument created
with odeset.
|
odeset
| Create and edit input arguments for ODE
solvers.
|
| |
|---|
New Matrix Functions
Function
Description
cholinc
| Incomplete Cholesky factorization.
|
gallery
| More than 50 new test matrices.
|
luinc
| Incomplete LU factorization.
|
repmat
| Replicate and tile an array.
|
sprand
| Random uniformly distributed sparse matrices.
|
| |
|---|
New Methods for Sparse Matrices
Method
Description
bicg
| BiConjugate Gradients method.
|
bicgstab
| BiConjugate Gradients Stabilized method.
|
cgs
| Conjugate Gradients Squared method.
|
eigs
| Find a few eigenvalues and eigenvectors.
|
gmres
| Generalized Minimum Residual method.
|
pcg
| Preconditioned Conjugate Gradients method.
|
qmr
| Quasi-Minimal Residual method.
|
svds
| A few singular values.
|
| |
|---|
Subscripting and Assignment Enhancements
In MATLAB 5, you can now:
A statement like A(ones([m,n])) now always returns an m-by-n array in which each element is A(1). In previous versions, the statement returned different results depending on whether A was or was not an m-by-n matrix.
In previous releases, expressions like A(2:3,4:5) = 5 resulted in an error. MATLAB 5 automatically "expands" the 5 to be the right size (that is, 5*ones(2,2)).
Integer Bit Manipulation Functions
The bitfun directory contains commands that permit bit-level operations on integers. Operations include setting and unsetting, complementing, shifting, and logical AND, OR, and XOR.
New Bitwise Functions
Function
Description
bitand
| Bitwise AND.
|
bitcmp
| Complement bits.
|
bitmax
| Maximum floating-point integer.
|
bitor
| Bitwise OR.
|
bitset
| Set bit.
|
bitshift
| Bitwise shift.
|
bittest
| Test bit.
|
bitxor
| Bitwise XOR.
|
| |
|---|
Dimension Specification for Data Analysis Functions
MATLAB's basic data analysis functions now enable you to supply a second input argument. This argument specifies the dimension along which the function operates. For example, create an array A:
A = [3 2 4; 1 0 5; 8 2 6];
To sum along the first dimension of A, incrementing the row index, specify 1 for the dimension of operation:
sum(A,1)

ans =

    12     4    15
To sum along the second dimension, incrementing the column index, specify 2 for the dimension:
sum(A,2)

ans =

     9
     6
    16
Other functions that accept the dimension specifier include prod, cumprod, and cumsum.
Wildcards in Utility Commands
The asterisk (*) can be used as a wildcard in the clear and whos commands. This allows you, for example, to clear only variables beginning with a given character or characters, as in
clear A*
Empty Arrays
Earlier versions of MATLAB allowed for only one empty matrix, the 0-by-0 matrix denoted by []. MATLAB 5 provides for matrices and arrays in which one, but not all, of the dimensions is zero. For example, 1-by-0, 10-by-0-by-20, and [3 4 0 5 2] are all possible array sizes.
The two-character sequence [] continues to denote the 0-by-0 matrix. Empty arrays of other sizes can be created with the functions zeros, ones, rand, or eye. To create a 0-by-5 matrix, for example, use
E = zeros(0,5)
The basic model for empty matrices is that any operation that is defined for m-by-n matrices, and that produces a result whose dimension is some function of m and n, should still be allowed when m or n is zero. The size of the result should be that same function, evaluated at zero.
For example, horizontal concatenation
C = [A B]
requires that A and B have the same number of rows. So if A is m-by-n and B is m-by-p, then C is m-by-(n+p). This is still true if m or n or p is zero.
Many operations in MATLAB produce row vectors or column vectors. It is now possible for the result to be the empty row vector
r = zeros(1,0)
or the empty column vector
c = zeros(0,1)
MATLAB 5 retains MATLAB 4 behavior for if and while statements. For example
if A, S1, else, S0, end
will execute statement S0 when A is an empty array.
Some MATLAB functions, like sum and max, are reductions. For matrix arguments, these functions produce vector results; for vector arguments they produce scalar results. Backwards compatibility issues arise for the argument [], which in MATLAB 4 played the role of both the empty matrix and the empty vector. In MATLAB 5, empty inputs with these functions produce these results:
New Data Analysis Features
MATLAB 5 provides an expanded set of basic data analysis functions.
New Statistical Data Analysis Functions
Function
Description
convhull
| Convex hull.
|
cumtrapz
| Cumulative trapezoidal numerical integration.
|
delaunay
| Delaunay triangularization.
|
dsearch
| Search for nearest point.
|
factor
| Prime factors.
|
inpolygon
| Detect points inside a polygonal region.
|
nchoosek
| All possible combinations of n elements taken k at a
time.
|
perms
| All possible permutations.
|
polyarea
| Area of polygon.
|
primes
| Generate a list of prime numbers.
|
sortrows
| Sort rows in ascending order.
|
tsearch
| Search for enclosing Delaunay triangle.
|
voronoi
| Voronoi diagram.
|
| |
|---|
MATLAB 5 also offers expanded data analysis in the areas of:
Higher-Dimension Interpolation
The new functions interp3 and interpn let you perform three-dimensional and multidimensional interpolation. ndgrid provides arrays that can be used in multidimensional interpolation.
New Interpolation Functions
Function
Description
interp3
| Three-dimensional data interpolation (table
lookup).
|
interpn
| Multidimensional data interpolation (table lookup).
|
ndgrid
| Generate arrays for multidimensional functions
and interpolation.
|
| |
|---|
griddata Based on Delaunay Triangulation
griddata supports triangle-based interpolation using nearest neighbor, linear, and cubic techniques. It creates smoother contours on scattered data using the cubic interpolation method.
Set Theoretic Functions
The functions union, intersect, ismember, setdiff, and unique treat vectors as sets, allowing you to perform operations like union (A
B), intersection (A
B), and difference (A-B) of such sets. Other set-theoretical operations include location of common set elements (ismember) and elimination of duplicate elements (unique).
New Set Functions
Function
Description
intersect
| Set intersection of two vectors.
|
ismember
| Detect members of a set.
|
setdiff
| Return the set difference of two vectors.
|
setxor
| Set XOR of two vectors.
|
union
| Set union of two vectors.
|
unique
| Unique elements of a vector.
|
| |
|---|
New and Enhanced Handle Graphics Features
MATLAB 5 features significant improvements to Handle Graphics. For details on all graphics functions, see Using MATLAB Graphics.
Plotting Capabilities
MATLAB's basic plotting capabilities have been improved and expanded in MATLAB 5.
New and Enhanced Plotting Capabilities
Function
Description
area
| Filled area plot.
|
bar3
| Vertical 3-D bar chart.
|
bar3h
| Horizontal 3-D bar chart.
|
barh
| Horizontal bar chart.
|
gplot
| "Graph theoretic" graph.
|
pie
| Pie chart.
|
pie3
| Three-dimensional pie chart.
|
plotyy
| Plot graphs with Y tick labels on left and right.
|
stem3
| Three-dimensional stem plot.
|
| |
|---|
area Function
The area function plots a set of curves and fills the area beneath the curves.
Bar Chart Enhancements
bar3, bar3h, and barh draw vertical and horizontal bar charts. These functions, together with bar, support multiple filled bars in grouped and stacked formats.
legend Enhancement
legend can label any solid-color patch and surface. You can now place legends on line, bar, ribbon, and pie plots, for example.
New Graph Annotation Functions
Function
Description
box
| Axes box.
|
datetick
| Display dates for Axes tick labels.
|
| |
|---|
Marker Style Enhancement
A number of new line markers are available, including, among others, a square, a diamond, and a five-pointed star. These can be specified independently from line style.
Stem Plot Enhancements
stem and stem3 plot discrete sequence data as filled or unfilled stem plots.
Three-Dimensional Plotting Support
quiver3 displays three-dimensional velocity vectors with (u,v,w) components. The ribbon function displays data as three-dimensional strips.
New Three-Dimensional Plotting Functions
Function
Description
quiver3
| Three-dimensional quiver plot.
|
ribbon
| Draw lines as 3-D strips.
|
rotate3d
| Three-dimensional rotation using the mouse.
|
| |
|---|
Data Visualization
MATLAB 5 features many new and enhanced capabilities for data visualization.
New Viewing Model
Axes camera properties control the orthographic and perspective view of the scene created by an Axes and its child objects. You can view the Axes from any location around or in the scene, as well as adjust the rotation, view angle, and target point.
New Method for Defining Patches
You can define a Patch using a matrix of faces and a matrix of vertices. Each row of the face matrix contains indices into the vertex matrix to define the connectivity of the face. Defining Patches in this way reduces memory consumption because you no longer need to specify redundant vertices.
Triangular Meshes and Surfaces
The new functions trimesh and trisurf create triangular meshes and surfaces from x, y, and z vector data and a list of indices into the vector data.
New Triangular Mesh and Surface Functions
Function
Description
trisurf
| Triangular surface plot.
|
trimesh
| Triangular mesh plot.
|
| |
|---|
Improved Slicing
slice now supports an arbitrary slicing surface.
Contouring Enhancements
The contouring algorithm now supports parametric surfaces and contouring on triangular meshes. In addition, clabel rotates and inserts labels in contour plots.
New Contour Plot
Function
Description
contourf
| Filled contour plot.
|
| |
|---|
New zoom Options
The zoom function supports two new options:
Graphics Presentation
MATLAB 5 provides improved control over the display of graphics objects.
Enhancements to Axes Objects
MATLAB 5 provides more advanced control for three-dimensional Axes objects. You can control the three-dimensional aspect ratio for the Axes' plot box, as well as for the data displayed in the plot box. You can also zoom in and out from a three-dimensional Axes using viewport scaling and Axes camera properties.
The axis command supports a new option designed for viewing graphics objects in 3-D:
axis vis3d
This option prevents MATLAB from stretching the Axes to fit the size of the Figure window and otherwise altering the proportions of the objects as you change the view.
In a two-dimensional view, you can display the x-axis at the top of an Axes and the y-axis at the right side of an Axes.
Color Enhancements
colordef white or colordef black changes the color defaults on the root so that subsequent figures produce plots with a white or black axes background color. The figure background color is changed to be a shade of gray, and many other defaults are changed so that there will be adequate contrast for most plots. colordef none sets the defaults to their MATLAB 4 values. In addition, a number of new colormaps are available.
New Figure and Axis Color Control
Function
Description
colordef
| Select Figure color scheme.
|
| |
|---|
New Colormaps
Function
Description
autumn
| Shades of red and yellow colormap.
|
colorcube
| Regularly spaced colors in RGB colorspace that provide more steps of gray, pure red, pure green, and
pure blue.
|
lines
| Colormap of colors specified by the Axes' ColorOrder property.
|
spring
| Shades of magenta and yellow colormap.
|
summer
| Shades of green and yellow colormap.
|
winter
| Shades of blue and green colormap.
|
| |
|---|
Text Object Enhancements
MATLAB 5 supports a subset of LaTex commands. A single Text graphics object can support multiple fonts, subscripts, superscripts, and Greek symbols. See the text function in the online MATLAB Function Reference for information about the supported LaTex subset.
You can also specify multiline character strings and use normalized font units so that Text size is a fraction of an Axes' or Uicontrol's height. MATLAB supports multiline text strings using cell arrays. Simply define a string variable as a cell array with one line per cell.
Improved General Graphics Features
The MATLAB startup file sets default properties for various graphics objects so that new Figures are aesthetically pleasing and graphs are easier to understand.
New Figure Window Creation and Control Commands
Command
Description
dialog
| Create a dialog box.
|
hgmenu
| Display default File and Edit menus for Figures.
|
| |
|---|
Z-buffering is now available for fast and accurate three-dimensional rendering.
Lighting
MATLAB supports a new graphics object called a Light. You create a Light object using the light function. Three important Light object properties are:
You cannot see Light objects themselves, but you can see their effect on any Patch and Surface objects present in the same Axes. You can control these effects by setting various Patch and Surface object properties - AmbientStrength, DiffuseStrength, and SpecularStrength control the intensity of the respective light-reflection characteristics;
SpecularColorReflectance and SpecularExponent provide additional control over the reflection characteristics of specular light.
The Axes AmbientLightColor property determines the color of the ambient light, which has no direction and affects all objects uniformly. Ambient light effects occur only when there is a visible Light object in the Axes.
The Light object's Color property determines the color of the directional light, and its Mode property determines whether the light source is a point source (Mode set to local), which radiates from the specified position in all directions, or a light source placed at infinity (Mode set to infinite), which shines from the direction of the specified position with parallel rays.
You can also select the algorithm used to calculate the coloring of the lit objects. The Patch and Surface EdgeLighting and FaceLighting properties select between no lighting, and flat, Gouraud, or Phong lighting algorithms.
print Command Revisions
The print command has been extensively revised for MATLAB 5. Consult Using MATLAB Grapics for a complete description of print command capabilities. Among the new options available for MATLAB 5:
Additional print Device Options
The print command has several new device options:
print Command Device Options
Device
Description
-dljet4
| HP LaserJet 4 (defaults to 600 dpi)
|
-ddeskjet
| HP DeskJet and DeskJet Plus
|
-ddjet500
| HP Deskjet 500
|
-dcdeskjet
| HP DeskJet 500C with 1 bit/pixel color
|
-dcdj500
| HP DeskJet 500C
|
-dcdj550
| HP Deskjet 550C
|
-dpjxl
| HP PaintJet XL color printer
|
-dpjxl300
| HP PaintJet XL300 color printer
|
-ddnj650c
| HP DesignJet 650C
|
-dbj200
| Canon BubbleJet BJ200
|
-dbjc600
| Canon Color BubbleJet BJC-600 and BJC-4000
|
-depsonc
| Epson LQ-2550 and Fujitsu 3400/2400/1200
|
-dibmpro
| IBM 9-pin Proprinter
|
-dtiffpack
| TIFF PackBits (tag = 32773) (monochrome)
|
-dbmp256
| 8-bit (256-color) BMP file format
|
-dbmp16m
| 24-bit BMP file format
|
-dpcxmono
| Monochrome PCX file format
|
-dpcx24b
| 24-bit color PCX file format, three 8-bit planes
|
-dpbm
| Portable Bitmap (plain format)
|
-dpbmraw
| Portable Bitmap (raw format)
|
-dpgm
| Portable Graymap (plain format)
|
-dpgmraw
| Portable Graymap (raw format)
|
-dppm
| Portable Pixmap (plain format)
|
-dppmraw
| Portable Pixmap (raw format)
|
-dbit
| A plain "bit bucket" device
|
-dbitrgb
| Plain bits, RGB
|
-dbitcmyk
| Plain bits, CMYK
|
| |
|---|
Image Support
MATLAB 5 provides a number of enhancements to image support. These enhancements include:
Truecolor
In addition to indexed images, in which colors are stored as an array of indices into a colormap, MATLAB 5 now supports truecolor images. A truecolor image does not use a colormap; instead, the color values for each pixel are stored directly as RGB triplets. In MATLAB, the CData property of a truecolor Image object is a three-dimensional (m-by-n-by-3) array. This array consists of three m-by-n matrices (representing the red, green, and blue color planes) concatenated along the third dimension.
Reading and Writing Images
The imread function reads image data into MATLAB arrays from graphics files in various standard formats, such as TIFF. You can then display these arrays using the image function, which creates a Handle Graphics® Image object. You can also write MATLAB image data to graphics files using the imwrite function. imread and imwrite both support a variety of graphics file formats and compression schemes.
8-Bit Images
When you read an image into MATLAB using imread, the data is stored as an array of 8-bit integers. This is a much more efficient storage method than the double-precision (64-bit) floating-point numbers that MATLAB typically uses.
The Handle Graphics Image object has been enhanced to support 8-bit CData. This means you can display 8-bit images without having to convert the data to double precision. MATLAB 5 also supports a limited set of operations on these 8-bit arrays. You can view the data, reference values, and reshape the array in various ways. To perform any mathematical computations, however, you must first convert the data to double precision, using the double function.
Note that, in order to support 8-bit images, certain changes have been made in the way MATLAB interprets image data. This table summarizes the conventions MATLAB uses:
Image
Type
Double-Precision Data
(Double Array)
8-Bit Data (uint8 Array)
Indexed
(colormap)
| Image is stored as a 2-D (m-by-n) array
of integers in the range
[1,length(colormap)]; colormap is an
m-by-3 array of floating-point values in
the range [0, 1]
| Image is stored as a 2-D (m-by-n) array
of integers in the range [0, 255];
colormap is an m-by-3 array of
floating-point values in the range [0, 1]
|
Truecolor
(RGB)
| Image is stored as a 3-D (m-by-n-by-3)
array of floating-point values in the
range [0, 1]
| Image is stored as a 3-D (m-by-n-by-3)
array of integers in the range [0, 255]
|
| | |
|---|
Note that MATLAB interprets image data very differently depending on whether it is double precision or 8-bit. The rest of this section discusses things you should keep in mind when working with image data to avoid potential pitfalls. This information is especially important if you want to convert image data from one format to another.
Indexed images
In an indexed image of class double, the value 1 points to the first row in the colormap, the value 2 points to the second row, and so on. In a uint8 indexed image, there is an offset; the value 0 points to the first row in the colormap, the value 1 points to the second row, and so on. The uint8 convention is also used in graphics file formats, and enables 8-bit indexed images to support up to 256 colors. Note that when you read in an indexed image with imread, the resulting image array is always of class uint8. (The colormap, however, is of class double; see below.)
If you want to convert a uint8 indexed image to double, you need to add 1 to the result. For example:
X64 = double(X8) + 1;
To convert from double to uint8, you need to first subtract 1, and then use round to ensure all the values are integers:
X8 = uint8(round(X64 - 1));
The order of the operations must be as shown in these examples, because you cannot perform mathematical operations on uint8 arrays.
When you write an indexed image using imwrite, MATLAB automatically converts the values if necessary.
Colormaps
Colormaps in MATLAB are always m-by-3 arrays of double-precision floating-point numbers in the range [0, 1]. In most graphics file formats, colormaps are stored as integers, but MATLAB does not support colormaps with integer values. imread and imwrite automatically convert colormap values when reading and writing files.
Truecolor Images
In a truecolor image of class double, the data values are floating-point numbers in the range [0, 1]. In a truecolor image of class uint8, the data values are integers in the range [0, 255].
If you want to convert a truecolor image from one data type to the other, you must rescale the data. For example, this call converts a uint8 truecolor image to double:
RGB64 = double(RGB8)/255;
This call converts a double truecolor image to uint8:
RGB8 = uint8(round(RGB*255));
The order of the operations must be as shown in these examples, because you cannot perform mathematical operations on uint8 arrays.
When you write a truecolor image using imwrite, MATLAB automatically converts the values if necessary.
New and Enhanced Handle Graphics Object Properties
This section lists new graphics object properties supported in MATLAB 5. It also lists graphics properties whose behavior has changed significantly.
Using MATLAB Graphics provides a more detailed description of each property.
Properties of All Graphics Objects
Property
Description
BusyAction
| Controls events that potentially interrupt
executing callback routines.
|
Children
| Enhanced behavior allows reordering of child
objects
|
CreateFcn
| A callback routine that executes when
MATLAB creates a new instance of the specific type of graphics object
|
DeleteFcn
| A callback routine that executes when
MATLAB deletes the graphics object
|
HandleVisibility
| Controls scope of handle visibility
|
Interruptible
| Now on by default
|
Parent
| Enhanced behavior allows reparenting of
graphics objects
|
Selected
| Indicates whether graphics object is in
selected state
|
SelectionHighlight
| Determines if graphics objects provide visual
indication of selected state
|
Tag
| User-specified object label
|
| |
|---|
Axes Properties
Property
Description
AmbientLightColor
| Color of the surrounding light illuminating
all Axes child objects when a Light object is
present.
|
CameraPosition
| Location of the point from which the Axes is
viewed.
|
CameraPositionMode
| Automatic or manual camera positioning.
|
CameraTarget
| Point in Axes viewed from camera position.
|
CameraTargetMode
| Automatic or manual camera target selection.
|
CameraUpVector
| Determines camera rotation around the
viewing axis.
|
CameraUpVectorMode
| Default or user-specified camera orientation.
|
CameraViewAngle
| Angle determining the camera field of view.
|
CameraViewAngleMode
| Automatic or manual camera field of view
selection.
|
DataAspectRatio
| Relative scaling of x-, y-, and z-axis data
units.
|
DataAspectRatioMode
| Automatic or manual axis data scaling.
|
FontUnits
| Units used to interpret the FontSize property
(allowing normalized text size).
|
Layer
| Draw axis lines below or above child objects.
|
NextPlot
| Enhanced behavior supports add, replace,
and replacechildren options.
|
PlotBoxAspectRatio
| Relative scaling of Axes plot box.
|
PlotBoxAspectRatioMode
| Automatic or manual selection of plot box
scaling.
|
Projection
| Select orthographic or perspective projection
type.
|
TickDirMode
| Automatic or manual selection of tick mark
direction (allowing you to change view and
preserve the specified TickDir).
|
XAxisLocation
| Locate x-axis at bottom or top of plot.
|
YAxisLocation
| Locate y-axis at left or right side of plot.
|
| |
|---|
Figure Properties
Property
Description
CloseRequestFcn
| Callback routine executed when you issue a
close command on a Figure.
|
Dithermap
| Colormap used for true-color data on pseudocolor displays.
|
DithermapMode
| Automatic dithermap generation.
|
IntegerHandle
| Integer or floating-point Figure handle.
|
PaperPositionMode
| WYSIWYG printing of Figure.
|
NextPlot
| Enhanced behavior supports add, replace,
and replacechildren options.
|
PointerShapeCData
| User-defined pointer data.
|
PointerShapeHotSpot
| Active point in custom pointer.
|
PrintPostProcess
| Commands to execute at the end of the
printing process.
|
Renderer
| Select painters or Z-buffer rendering or
enable MATLAB to select automatically.
|
Resize
| Determines if Figure window is resizeable.
|
ResizeFcn
| Callback routine executed when you resize
the Figure window.
|
| |
|---|
Image Properties
Property
Description
CData
| Enhanced behavior allows true color (RGB
values) specification.
|
CDataMapping
| Select direct or scaled interpretation of
indexed colors.
|
| |
|---|
Light Properties
Property
Description
Color
| Color of the light source.
|
Position
| Place the light source within Axes space.
|
Style
| Select infinite or local light source.
|
| |
|---|
Line Properties
Property
Description
Marker
| The marker symbol to use at data points
(markers are now separate from line style).
|
MarkerEdgeColor
| The color of the edge of the marker symbol.
|
MarkerFaceColor
| The color of the face of filled markers.
|
| |
|---|
Patch Properties
Property
Description
AmbientStrength
| The strength of the Axes ambient light on
the particular Patch object.
|
CData
| Enhanced behavior allows true color (RGB
values) specification.
|
CDataMapping
| Select direct or scaled interpretation of
indexed colors.
|
DiffuseStrength
| Strength of the reflection of diffuse light
from Light objects.
|
FaceLightingAlgorithm
| Lighting algorithm used for Patch faces.
|
Faces
| The vertices connected to define each face.
|
FaceVertexCData
| Color specification when using the Faces
and Vertices properties to define a Patch.
|
LineStyle
| Type of line used for edges.
|
Marker
| Symbol used at vertices.
|
MarkerEdgeColor
| The color of the edge of the marker symbol.
|
MarkerFaceColor
| The color of the face of filled markers.
|
MarkerSize
| Size of the marker.
|
NormalMode
| MATLAB-generated or user-specified normal
vectors.
|
SpecularColorReflectance
| Control the color of the specularly reflected
light from Light objects.
|
SpecularExponent
| Control the shininess of the Patch object.
|
SpecularStrength
| Strength of the reflection of specular light
from Light objects.
|
VertexNormals
| Definition of the Patch's normal vectors.
|
Vertices
| The coordinates of the vertices defining the
Patch.
|
| |
|---|
Root Properties
Property
Description
CallbackObject
| Handle of object whose callback is currently
executing.
|
ErrorMessage
| Text of the last error message issued by
MATLAB.
|
ErrorType
| The type of the error that last occurred.
|
ShowHiddenHandles
| Show or hide graphics object handles that
are marked as hidden.
|
TerminalHideGraphCommand
| Command to hide graphics window when
switching to command mode.
|
TerminalDimensions
| Size of graphics terminal.
|
TerminalShowGraphCommand
| Command to expose graphics window when
switching from command mode to graphics
mode.
|
| |
|---|
Surface Properties
Property
Description
AmbientStrength
| The strength of the Axes ambient light on
the particular Surface object.
|
CData
| Enhanced behavior allows true color (RGB
values) specification.
|
CDataMapping
| Selects direct or scaled interpretation of
indexed colors.
|
DiffuseStrength
| Strength of the reflection of diffuse light
from Light objects.
|
FaceLightingAlgorithm
| Lighting algorithm used for Surface faces.
|
Marker
| Symbol used at vertices.
|
MarkerEdgeColor
| The color of the edge of the marker symbol.
|
MarkerFaceColor
| The color of the face of filled markers.
|
MarkerSize
| Size of the marker.
|
NormalMode
| MATLAB generated or user-specified normal
vectors.
|
SpecularColorReflectance
| Control the color of the specularly reflected
light from Light objects.
|
SpecularExponent
| Control the shininess of the Surface object.
|
SpecularStrength
| Strength of the reflection of specular light
from Light objects.
|
VertexNormals
| Definition of the Surface's normal vectors.
|
Vertices
| The coordinates of the vertices defining the
Surface.
|
| |
|---|
Text Properties
Property
Description
FontUnits
| Select the units used to interpret the FontSize property (allowing normalized text
size).
|
Interpreter
| Allows MATLAB to interpret certain characters as LaTex commands.
|
| |
|---|
Uicontrol Properties
Property
Description
Enable
| Enable or disable (gray out) uicontrols.
|
FontAngle
| Select character slant.
|
FontName
| Select font family.
|
FontSize
| Select font size.
|
FontUnits
| Select the units used to interpret the FontSize property (allowing normalized text
size).
|
FontWeight
| Select the weight of text characters.
|
ListboxTop
| Select the listbox item to display at the top of
the listbox.
|
SliderStep
| Select the size of the slider step.
|
Style
| Enhanced to include listbox device.
|
| |
|---|
Uimenu Properties
Property
Description
Enable
| Enable or disable (gray out) uicontrols.
|
| |
|---|
Improvements to Graphical User Interfaces (GUIs)
General GUI Enhancements
MATLAB 5 provides general enhancements that are useful in the GUI area:
MATLAB 5 provides features that make it easier to create MATLAB GUIs. Major enhancements include List Box objects to display and select one or more list items. You can also create modal or non-modal error, help, and warning message boxes. In addition, uicontrol edit boxes now support multiline text.
New GUI Controls
Function
Description
msgbox
| Display message box.
|
dragrect
| Drag pre-defined rectangles.
|
inputdlg
| Display a dialog box to input data.
|
questdlg
| Question dialog.
|
rbbox
| Rubberband box.
|
selectmoveresize
| Interactively select, move, or resize objects.
|
| |
|---|
MATLAB 5 also provides more flexibility in callback routines. You can specify callbacks that execute after creating, changing, and deleting an object.
New Program Execution Controls
Function
Description
uiresume
| Resume suspended M-file execution.
|
uiwait
| Blocks program execution.
|
waitfor
| Blocks execution until a condition is satisfied.
|
| |
|---|
Guide
Guide is a Graphical User Interface (GUI) design tool. In other words, it makes it easy to create and modify GUIs in MATLAB. The individual pieces of the Guide environment are designed to work together, but they can also be used individually. For example, there is a Property Editor (invoked by the command propedit) that allows you to modify any property of any Handle Graphics object, from a figure to a line. Point the Property Editor at a line and you can change its color, position, thickness, or any other line property.
The Control Panel is the centerpiece of the Guide suite of tools. It lets you "control" a figure so that it can be easily modifed by clicking and dragging. As an example, you might want to move a button from one part of a figure to another. From the Control panel you put the button's figure into an editable state, and then it's simply a matter of dragging the button into the new position. Once a figure is editable, you can also add new uicontrols, uimenus, and plotting axes.
Guide Tools
Tool
Command
Description
Control Panel
| guide
| Control figure editing.
|
Property Editor
| propedit
| Modify object properties.
|
Callback Editor
| cbedit
| Modify object callbacks.
|
Alignment Tool
| align
| Align objects.
|
Menu Editor
| menuedit
| Modify figure menus.
|
| | |
|---|
Enhancements to the Application Program Interface (API)
The MATLAB 5 API introduces data types and functions not present in MATLAB 4. This section summarizes the important changes in the API. For details on any of these topics, see the MATLAB Application Program Interface Guide.
New Fundamental Data Type
The MATLAB 4 Matrix data type is obsolete. MATLAB 5 programs use the mxArray data type in place of Matrix. The mxArray data type has extra fields to handle the richer data constructs of MATLAB 5.
Functions that expected Matrix arguments in MATLAB 4 expect mxArray arguments in MATLAB 5.
New Functions
The API introduces many new functions that work with the C language to support MATLAB 5 features.
Support for Structures and Cells
MATLAB 5 introduces structure arrays and cell arrays. Therefore, the MATLAB 5 API introduces a broad range of functions to create structures and cells, as well as functions to populate and analyze them. See "How to Convert Each MATLAB 4 Function" for a complete listing of these functions.
Support for Multidimensional Arrays
The MATLAB 4 Matrix data type assumed that all matrices were two-dimensional. The MATLAB 5 mxArray data type supports arrays of two or more dimensions. The MATLAB 5 API provides two different mxCreate functions that create either a two-dimensional or a multidimensional mxArray.
In addition, MATLAB 5 introduces several functions to get and set the number and length of each dimension in a multidimensional mxArray.
Support for Nondouble Precision Data
The MATLAB 4 Matrix data type represented all numerical data as double-precision floating-point numbers. The MATLAB 5 mxArray data type can store numerical data in six different integer formats and two different floating-point formats.
Note
Although the MATLAB API supports these different data representations, MATLAB itself does not currently provide any operations or functions that work with nondouble precision data. Nondouble precision data may be viewed, however.
Access toSpecial Numbers
Several mex-prefix functions that access special numbers such as Infinity, NaN, and eps have been renamed. The new names use the mx prefix instead of the mex prefix. For example, mexGetEps is obsolete; call mxGetEps instead. These functions are now available from the stand-alone interfaces.
OLE Support
The MATLAB API now provides OLE support on the Windows platforms.
MATLAB 4 Features Unsupported in MATLAB 5
Non-ANSI C Compilers
MATLAB 4 let you compile MATLAB applications with non-ANSI C compilers. MATLAB 5 requires an ANSI C compiler.
printf and scanf
MATLAB 5 MEX-files no longer support calls to the ANSI C printf and scanf. Instead of calling printf, your MEX-file should always call mexPrintf. Instead of calling scanf, your MEX-file should call mexCallMATLAB with the fifth argument set to the input function.
New Platform Specific Features
Two features are available on both the Macintosh and MS Windows platforms:
MS Windows
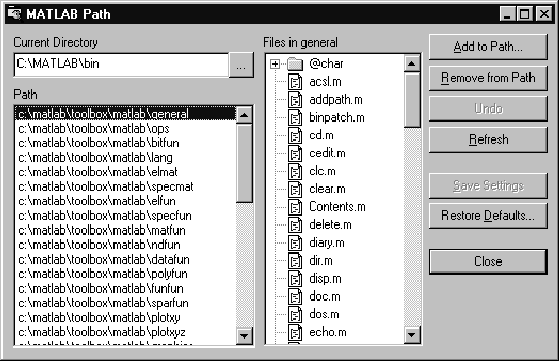
Path Browser
The Path Browser lets you view and modify the MATLAB search path. All changes take effect in MATLAB immediately.
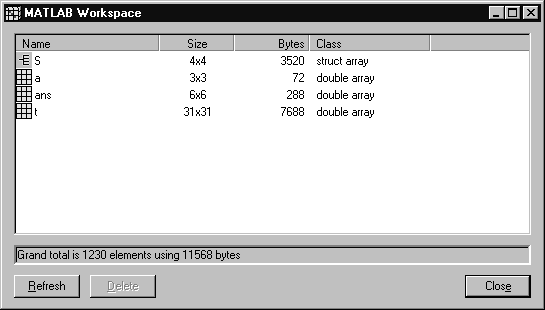
Workspace Browser
The Workspace Browser lets you view the contents of the current MATLAB workspace. It provides a graphical representation of the traditional whos output. In addition, you can clear workspace variables and rename them
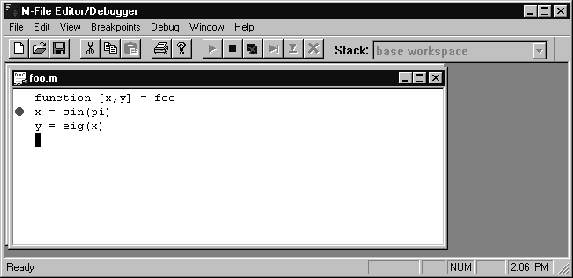
M-File Debugger
The graphical M-file debugger allows you to set breakpoints and single-step through M-code. The M-file debugger starts automatically when a breakpoint is hit.
Command Window Toolbar
A toolbar is now optionally present for the Command Window. The toolbar provides single-click access to several commonly used operations

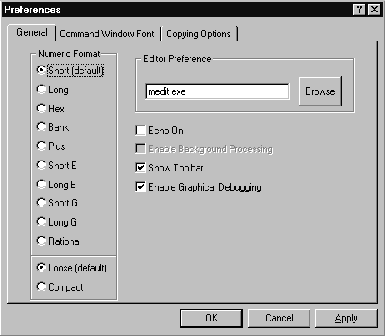
New Dialog Boxes
New Preferences dialog boxes are accessible through the File menu. Some of these were previously available through the Options menu in MATLAB 4. There are three categories of preferences:
Macintosh
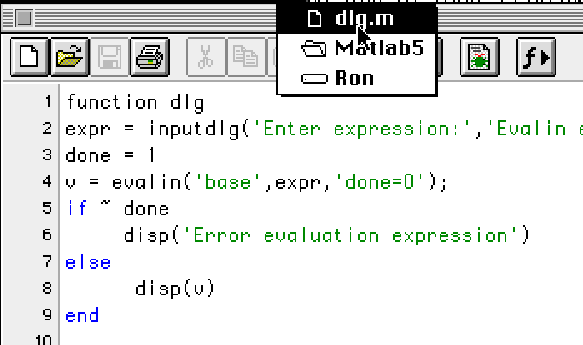
User Interface Enhancements
- Optional toolbars in the Command Window, Editor windows, and M-file debugger allow rapid access to commonly used features.

- Color syntax highlighting in the Command Window, Editor windows, and M-file debugger provides visual cues for identifying blocks of code, comments, and strings.
- Almost all lists and text items in the Command Window, Editor, Path Browser, Workspace Browser, M-file debugger, and Command History Window have optional dynamic or "live" scrolling; the display is scrolled as the scroll box of a scrollbar is moved.
- Macintosh Drag and Drop is supported throughout MATLAB for rapid and easy exchange of text between windows.
Command Window Features
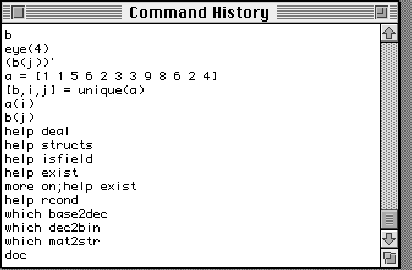
Command History Window
The Command History window contains a list of all commands executed from the Command Window. Commands are saved between MATLAB sessions, so you can select and execute a group of commands from a previous day's work to continue quickly from where you left off.
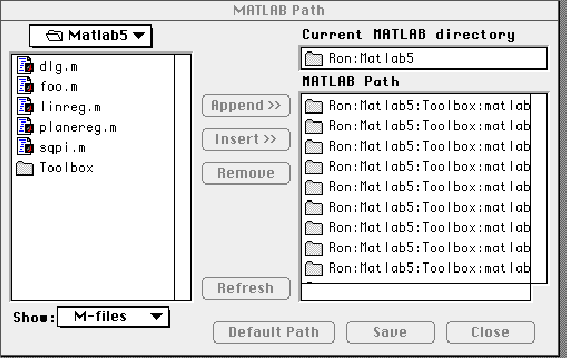
Path Browser
The Path Browser provides an intuitive, easy-to-use graphical interface for viewing and modifying the MATLAB search path. The search path may be reordered or modified simply by dragging items in the path list.
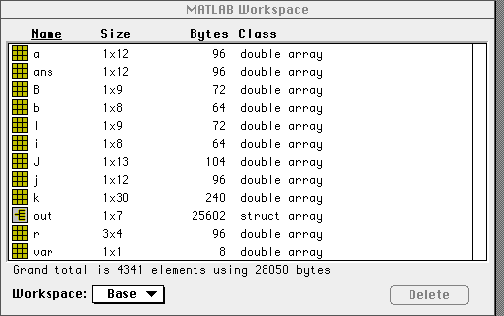
Workspace Browser
The Workspace Browser allows you to view the contents of the current MATLAB workspace. It provides a graphic representation of the traditional whos output. You can delete variables from the workspace and sort the workspace by various criteria. Double-clicking workspace variables displays that variable's contents in the Command Window.
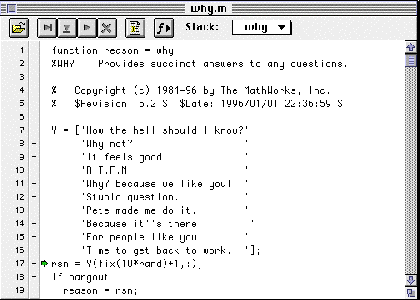
M-File Debugger
MATLAB 5 includes a graphical M-file debugger, which allows you to set breakpoints and single-step through M-code. Selecting text in the debugger window and pressing the Enter (not the Return) key evaluates that text in the Command Window.
Editor Features
UNIX Workstations
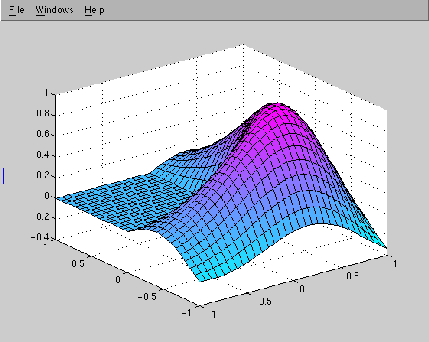
Figure Window Toolbar
The Figure window now provides a toolbar with a File pulldown menu. Selecting the Print option on the File menu activates a set of pushbuttons that allow easy setting of the most frequently used print options.
Path Editor
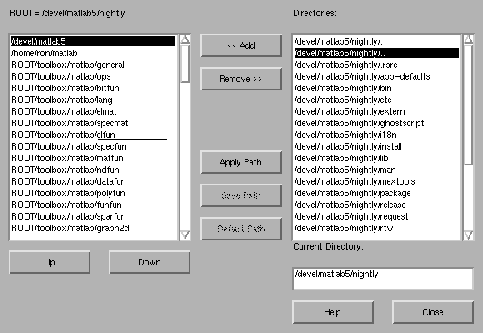
The pathedit command displays a GUI that allows you to view and modify your MATLAB search path.
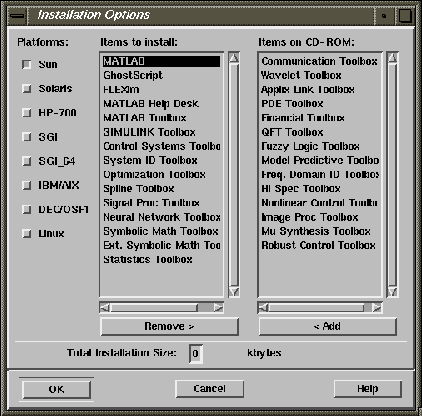
Simplified Installation Procedure
The installation procedure now uses a GUI to select or deselect products and platforms.
[ Previous | Help Desk | Next ]


 The Workspace Browser lets you view the contents of the current MATLAB workspace. It provides a graphical representation of the traditional
  The graphical M-file debugger allows you to set breakpoints and single-step through M-code. The M-file debugger starts automatically when a breakpoint is hit.
 A toolbar is now optionally present for the Command Window. The toolbar provides single-click access to several commonly used operations


 The Path Browser provides an intuitive, easy-to-use graphical interface for viewing and modifying the MATLAB search path. The search path may be reordered or modified simply by dragging items in the path list.
 The Workspace Browser allows you to view the contents of the current MATLAB workspace. It provides a graphic representation of the traditional
  MATLAB 5 includes a graphical M-file debugger, which allows you to set breakpoints and single-step through M-code. Selecting text in the debugger window and pressing the Enter (not the Return) key evaluates that text in the Command Window.
 The
The 
