| MATLAB Functions | Help Desk |
errorbar
Plot error bars along a curveerrorbar(Y,E)
errorbar(X,Y,E)
errorbar(X,Y,L,U)
errorbar(...,LineSpec)
h = errorbar(...)
Error bars show the confidence level of data or the deviation along a curve.
errorbar(Y,E)
plots Y and draws an error bar at each element of Y. The error bar is a distance of E(i) above and below the curve so that each bar is symmetric and 2*E(i) long.
errorbar(X,Y,E)
plots X versus Y with symmetric error bars 2*E(i) long. X, Y, E must be the same size. When they are vectors, each error bar is a distance of E(i) above and below the point defined by (X(i),Y(i)). When they are matrices, each error bar is a distance of E(i,j) above and below the point defined by (X(i,j),Y(i,j)).
errorbar(X,Y,L,U)
plots X versus Y with error bars L(i)+U(i) long specifying the lower and upper error bars. X, Y, L, and U must be the same size. When they are vectors, each error bar is a distance of L(i) below and U(i) above the point defined by (X(i),Y(i)). When they are matrices, each error bar is a distance of L(i,j) below and U(i,j) above the point defined by (X(i,j),Y(i,j)).
errorbar(...,LineSpec)
draws the error bars using the line type, marker symbol, and color specified by LineSpec.
h = errorbar(...)
returns a vector of handles to Line graphics objects.
When the arguments are all matrices, errorbar draws one line per matrix column. If X and Y are vectors, they specify one curve.
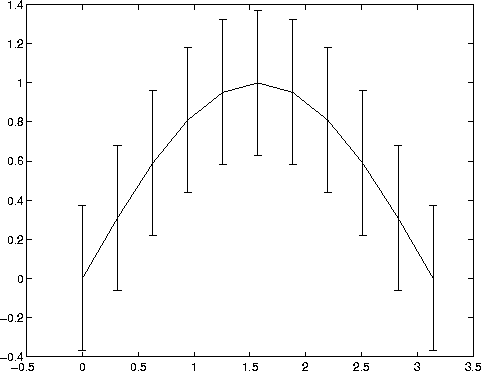
Draw symmetric error bars that are two standard deviation units in length:
X = 0:pi/10:pi;
Y = sin(X);
E = std(Y)*ones(size(X));
errorbar(X,Y,E)

LineSpec, plot
The std function in the online MATLAB Function Reference for more informatoin.