| MATLAB Functions | Help Desk |
ezplot
Easy to use function plotter.ezplot(f) ezplot(f,[xmin xmax]) ezplot(f,[xmin xmax],fig)
ezplot(f) plots a graph of f(x), where f is a symbolic expression representing a mathematical expression involving a single symbolic variable, say x. The domain on the x-axis is usually [-2*pi, 2*pi].
ezplot(f,[xmin xmax]) uses the specified x-domain instead of the default [-2*pi, 2*pi].
ezplot(f,[xmin xmax],fig) uses the specified Figure number instead of the current Figure. It also omits the title of the graph.
Either of the following commands,
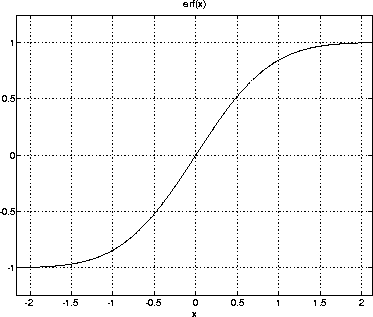
plot a graph of the error function::ezplot('erf(x)')ezplot erf(x)

ezplot determines the interval of the x-axis by sampling the function between -2*pi and 2*pi and then selecting a subinterval where the variation is significant. For the range of the y-axis, ezplot omits extreme values associated with singularities.
fplot