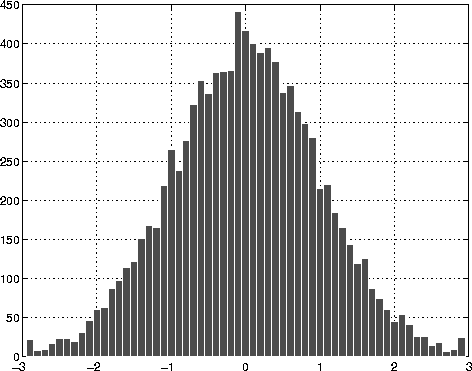
x = -2.9:0.1:2.9;
y = randn(10000,1);
hist(y,x) 
| MATLAB Functions | Help Desk |
hist
Histogram plothist(Y) hist(Y,x) hist(Y,nbins) [n,xout] = hist(...)A histogram shows the distribution of data values.
hist(Y)
draws a histogram of the elements in Y. hist distributes the bins along the x-axis between the minimum and maximum values of Y.
hist(Y,x)
draws a histogram using n bins, where n is length(x). x also specifies the locations on the x-axis where hist places the bins. For example, if x is a 5-element vector, hist distributes the elements of Y into five bins centered on the x-axis at the elements in x.
hist(Y,nbins)
draws a histogram with no more bins than nbins.
[n,xout] = hist(...)
returns vectors n and xout containing the frequency counts and the bin locations. This syntax does not generate a plot. This is useful when you need more control over the appearance of a graph, for example, to combine a histogram into a more elaborate plot. You can use bar(xout,n) to plot the histogram.
All elements in vector Y or in one column of matrix Y are grouped according to their numeric range. Each group is shown as one bin.
The histogram's x-axis reflects the range of values in Y. The histogram's y-axis shows the number of elements that fall within the groups; therefore, the y-axis ranges from 0 to the greatest number of elements deposited in any bin.
Generate a bell-curve histogram from Gaussian data.
x = -2.9:0.1:2.9;y = randn(10000,1); hist(y,x)

bar, stairs