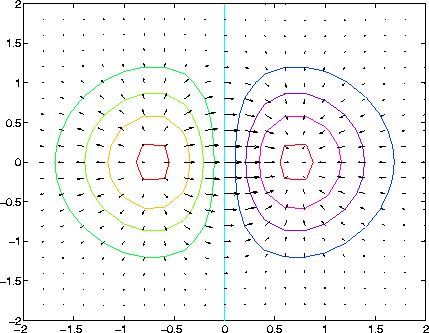
[X,Y] = meshgrid(-2:.2:2);
Z = X.*exp(-X.^2 - Y.^2);
[DX,DY] = gradient(Z,.2,.2);
contour(X,Y,Z)
hold on
quiver(X,Y,DX,DY)
grid off
hold off
| MATLAB Functions | Help Desk |
quiver
Quiver or velocity plotquiver(U,V) quiver(X,Y,U,V) quiver(...,scale) quiver(...,A quiver plot displays vectors with components (u,v) at the points (x,y).LineSpec) quiver(...,LineSpec,'filled') h = quiver(...)
quiver(U,V)
draws vectors specified by U and V at the coordinates defined by x = 1:n and y = 1:m, where [m,n] = size(U) = size(V). This syntax plots U and V over a geometrically rectangular grid. quiver automatically scales the vectors based on the distance between them to prevent them from overlapping.
quiver(X,Y,U,V)
draws vectors at each pair of elements in X and Y. If X and Y are vectors, length(X) = n and length(Y) = m, where [m,n] = size(U) = size(V). The vector X corresponds to the columns of U and V, and vector Y corresponds to the rows of U and V.
quiver(...,scale)
automatically scales the vectors to prevent them from overlapping, then multiplies them by scale. scale = 2 doubles their relative length and scale = 0.5 halves them. Use scale = 0 to plot the velocity vectors without the automatic scaling.
quiver(...,LineSpec)
specifies line style, marker symbol, and color using any valid line specification. quiver draws the markers at the origin of the vectors.
quiver(...,LineSpec,'filled')
fills markers specified by LineSpec.
h = quiver(...)
returns a vector of Line handles.
If X and Y are vectors, this function behaves as
[X,Y] = meshgrid(x,y)
quiver(X,Y,U,V)
Plot the gradient field of the function :
:
[X,Y]=meshgrid(-2:.2:2);Z=X.*exp(-X.^2 - Y.^2);[DX,DY] =gradient(Z,.2,.2);contour(X,Y,Z)holdon quiver(X,Y,DX,DY)gridoff hold off

contour, LineSpec, plot, quiver3