Example: Network Optimizer in the Interactive Optimizer
 PREVIOUS
NEXT
| ILOG CPLEX 11.0 User's Manual > Continuous Optimization > Solving Network-Flow Problems > Example: Network Optimizer in the Interactive Optimizer |
Example: Network Optimizer in the Interactive Optimizer |
INDEX
 PREVIOUS
NEXT
|
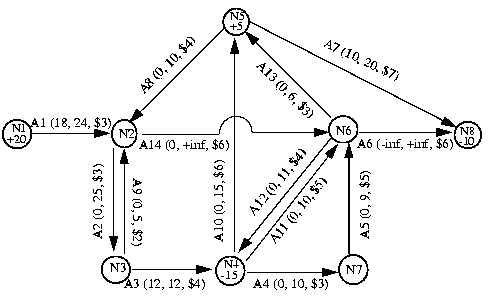
This example is based on a network where the aim is to minimize cost and where the flow through the network has both cost and capacity. Figure 11.1 shows you the nodes and arcs of this network. The nodes are labeled by their identifying node number from 1 through 8. The number inside a node indicates its supply value; 0 (zero) is assumed where no number is given. The arcs are labeled 1 through 14. The lower bound l, upper bound u, and objective value c of each arc are displayed in parentheses (l, u, c) beside each arc. In this example, node 1 and node 5 are sources, representing a positive net flow, whereas node 4 and node 8 are sinks, representing negative net flow.

The example in Figure 11.1 corresponds to the results of running the netex1.c. If you run that application, it will produce a file named netex1.net which can be read into the Interactive Optimizer with the command read netex1.net. After you read the problem into the Interactive Optimizer, you can solve it with the command netopt or the command optimize.
| Copyright © 1987-2007 ILOG S.A. All rights reserved. Legal terms. | PREVIOUS NEXT |