GEOSim
In a GIS, data can be represented in two main different formats (Korte 2001)[1]. The first format, raster, defines a matrix of points. In each cell, a numerical code is defined. This code, usually a real number, can represent different kinds of geographical data, such as elevations and terrain properties. The second format, vector, defines a set of vectors that represent geographical data. This format comes closer to the natural representation of geographical data on paper. Figure 1 explains how reality is represented using these two alternatives. Vector data is shown on the left and raster data is shown on the right.
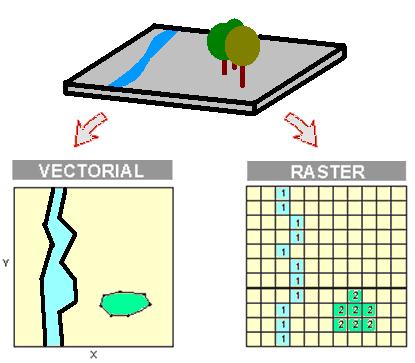
Figure 1: Raster and vector layers of a GIS.
Using a cellular automata to use GIS data in a model is not a new concept. Studies in this area can be reviewed in Benenson and Torrens (2004) and Fonseca and Casanovas (2004).
The nexts sections describe the different elements needed for this use and the data used in the simulation engine. A wildfire model using this approach is presented as an example. This example can be reviewed in the projects section and is based on Rothermel's mathematical model (Rothermel 1972, 1983).
GIS layers
This section classify the different structures used as layers in the simulation model in this study (Fonseca and Casanovas et al. 2004).
- 2DLayers (vector layers): These layers represent the common geography layers of a GIS, such as points, polylines, text and lines. Added to the virtual model, these elements usually represent information for the observer but not for the simulation model. They usually do not have specific behaviors. However, simple behaviors may be defined for the entire layer.
- 3DLayers (raster layers): These layers are used to represent fixed populations of elements such as forests or cities (each tree has its own location in a DEM). The restriction is that all elements must have the same virtual representation and behavior. A raster file is used to establish the exact position of each object. This file contains a matrix of data that shows the position of each element. There are two different kinds of raster file. The first kind uses a binary data structure, which only represents the absence or presence of the object represented by the 3DLayer in a given position; in this case, the object is located just over the DEM. The second kind of file uses a data matrix that represents the position of the object in the Y-axis position (elevation). Obviously, in this second approach, the no-data value shows that there is no element in this position[3]. In the wildfire sample, we use
- 3DLayers to represent the forest trees that can be burned by the fire. The simulator can interact with these elements individually in order to simulate wildfire propagation.
- Objects: The limitation of using layers is that all elements of a given layer must have the same behavior. If we need to represent an element with specific or individual behavior, we must use “Objects” (2DObjects or 3DObjects).
- 2DObjects: These objects represent lines, polylines, texts and points with individual behavior – for instance, a point with a touch sensor that shows certain information.
- 3DObjects: These are virtual objects that are not associated with any layer. They can have unique behavior represented by a script or program connected to the world (through EAI[4] for instance).
Routes: Routes define the movements of 3DObjects through the virtual landscape. These objects may or may not be part of a 3DLayer. Routes can also be defined by the simulator. They allow the different elements to move through the landscape in accordance with the simulator’s logic.
Some 3DObjects are integrated with a GPS. As a result, simulators can implement training systems. Elements can be located in the real world and be placed in the model, and hence the implications of their locations or actions can be determined.
| Layer | GPS integration |
| DEM | Georeferenced |
| 2DLayers | Georeferenced |
|
3DLayers
|
Georeferenced |
| Routes | Track points |
| 2DObjects | Waypoints |
| 3DObjects | Waypoints |
Table 1: Integration of layers with GPS.
Each of these different elements can be used in a simulation model. For instance, 3D layers can represent forests. Each 3D layer can represent a specific kind of vegetation. 2D layers can represent rivers or territorial divisions, or the wind direction in a wildfire-propagation model.
Once all the needed data is defined, some kind of interface must be defined in order to use it in the simulation model.
GIS, virtual reality and simulation
Outdoor simulation models may require a huge set of GIS data. Consequently, an interface must be established between this data and the simulation model that allows the data to be represented and used in the model.
Virtual reality helps represent landscapes, theoretically more realistically than any other technology. It helps represent not only visual landscapes but also computer data. Virtual reality stores the physical structures of a landscape and the simulator uses those physical structures to enable interaction with landscape elements. This also makes it possible to perform active queries on the outdoor simulation model.
In recent years, the main providers of GIS tools have developed several techniques for improving data representation, especially in 3D. Some only show a static 3D view, while others allow a 3D view with navigation, free flying or recorded animation over the data representation. In our approach, we use virtual reality techniques (using VRML 2.0 as the standard representation language; see Andrea L. Ames (2000)) to enable powerful interaction with the various model elements. Obviously, the GIS data must be prepared and converted to VRML and sensors, scripts for dynamic behavior and other functionalities based on External Authoring Interface (EAI) must be added.
In our wildfire implementation, for instance, the GIS stores the data that represents the landscape – basically the DEM model and the vegetation structure – in virtual reality format. Through this representation, the simulation model knows the configuration of the terrain and can facilitate interaction between it and the various model elements. The difference between a virtual DEM representation and a simple DEM is the interaction. A virtual DEM representation enables interaction between one or more users and the landscape. These users can navigate the virtual landscape, respecting certain rules such as collision detection and gravity, which can be defined in the virtual representation of a DEM but are never defined in a DEM. These rules are useful because the simulator needs not only the structure of the landscape but also the most important rules applied to it (gravity, collision detection, lights, etc.). These rules help define the relationship between the simulation model and the landscape.
Virtual landscape generation
Data can be converted from GIS to virtual reality using specific tools such as VirtualLands© (Figure 2). This tool works with several of the most common GIS file formats (shape, raster, DEM, etc.) and converts them to analogous layers in VRML, exports data to LeanSim® file formats and builds a VRML file that contains all the information needed to simulate or query the GIS data in a 3D view.
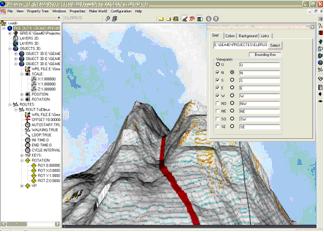
Figure 2: VirtualLands©.
References:
Ames, Andrea L.; Nadeau, David R.; Moreland, John L. 2000. VRML 2.0 Sourcebook, 2E. 688.
Benenson, Itzhak; Torrens, Paul M. 2004. Geosimulation: automata-based modeling of urban phenomena. Wiley.
Fonseca i Casas, Pau; Casanovas, Josep; Montero, Jordi. 2004. GIS and simulation system integration in a virtual reality environment. Proceedings of GISRUK 2004.
Malczewski, Jacek. 1999, GIS and Multicriteria Decision Analysis, John Wiley and Sons, 408 pages, ISBN 0471329444
Rothermel, R. 1972. A mathematical model for predicting fire spread in wildland fuels. Research Paper INT115. Ogden, UT: US Department of Agriculture, Forest Service, Intermountain Forest and Range Experiment Station.
Rothermel, R. C. 1983. How to predict the spread and intensity of forest and range fires. USDA Forest Service Research Paper, INT115. US Department of Agriculture, Forest Service, Intermountain Forest and Range Experiment Station.
Pau Fonseca i Casas
Department of Statistics and Operations Research
Universitat Politècnica de Catalunya - BarcelonaTECH
North Campus - C5218 Room
Barcelona, 08034, SPAIN
Tel. (+34) 93 4017035
Fax. (+34) 93 4015855
![]()
![]()
![]()
![]()
![]()
![]()